While the current dynamics of Worldwide Science outputs are rising to the surface Research Institutions from developing countries with important results; the location of Institutions holding excellence outcomes, that is, those which represent a truly and significant science advancement does not seem to be changing.
Although a formal study would need a detailed analysis by scientific fields, an exploratory analysis of the group formed by the Research Institutions which annually publish 100 scientific papers or more (3,000 worldwide, as indexed in Scopus database) reveals that the resulting geographic distribution has a strong bias which is explained by research spending patterns in different regions of the world. There is a large concentration of institutions in North America, Europe, India, China and Japan, and to a lesser extent, in the southern hemisphere, in Chile, Argentina and more prominently in Brazil, South Africa and Australia.
Neighborhood influence
By depicting Research Institutions grouped into four levels of Normalized Impact (NI), a picture, as the one exposed, of the geographic distribution of Research Excellence around the world is obtained. Taking into account that, with odd exceptions, institutions reaching NI scores higher than the world average (values higher than 1) are concentrated in North America, Western Europe and Australia/New Zeeland, we must conclude that if the geographic bias in Scientific Outputs is high, it is even higher the bias affecting the Scientific Impact.
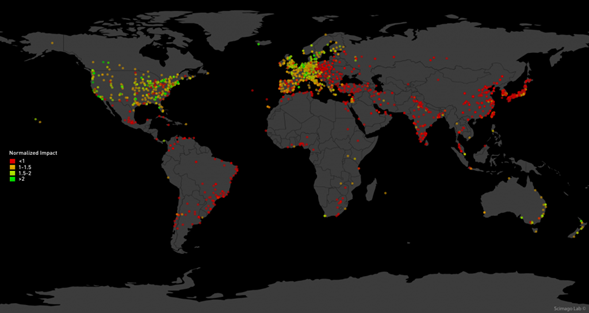
Impact can be considered to reflect the use researchers make of the scientific knowledge previously generated. With this in mind, the map suggests that those regions that produce the most (Western Europe and North America) firstly use the knowledge being generated in their area, justifying this way the concentration of large impacts in highly productive regions and implying that Research Institutions in the most productive regions worldwide accumulate a reputational capital, which is due to the geographical context where they are, and on the other hand, that is unattainable for institutions located in less productive regions. It is still to be seen what will happen with China, a newcomer to the elite of more productive scientific countries in the world. Put another way, the neighborhood of a Research Institution affects the scientific reputation it can achieve in global terms, unless it can go beyond its neighborhood through inter-regional alliances with reputed institutions from highly productive regions.
Scientific Dependence
To developing countries, an unintended consequence of the need to collaborate with researchers from highly productive regions is what it could be called “scientific dependence”. Even though it is difficult to measure the role played by researchers in scientific works by just studying the affiliation fields, what we really know is that certain Research Institutions show extremely high rates of International Collaboration (IC) which indeed can be associated to situations of scientific dependence. I.e. when an Institution’s IC reaches or exceeds 80% of its total output, in such a way that its exclusive production ends being marginal, it is clear that it operates in a “scientific dependence” situation. Furthermore, when an institution shows high collaboration rates jointly with an outstanding impact (NI) within its own country and/or region, such impact will be most likely due to the collaboration, and it may be concluded that there exists an external scientific dependence.
Some countries from Latin America constitute an example and an interesting case of scientific dependence in cases where a less scientific development, a highly international collaboration rate and a relatively high impact in a regional scale come together. See the high correlation between IC and NI values in the following table.
| COUNTRY | OUTPUT | IC | NI |
| Brazil | 135,259 | 25.35 | 0.77 |
| México | 52,527 | 38.65 | 0.75 |
| Argentina | 34,927 | 42.93 | 0.90 |
| Chile | 20,534 | 52.64 | 0.95 |
| Venezuela | 8,489 | 44.40 | 0.65 |
| Colombia | 8,292 | 53.90 | 0.83 |
| Cuba | 6,915 | 39.38 | 0.46 |
| Puerto Rico | 4,476 | 57.95 | 1.00 |
| Uruguay | 2,711 | 64.66 | 0.95 |
| Perú | 2,654 | 75.77 | 1.13 |
| Costa Rica | 1,946 | 71.17 | 1.16 |