Felix de Moya Anegón.
The major European national research councils – Max Plank Society from Germany, Centre National de la Recherche Scientifique (CNRS) from France, Italian’s Consiglio Nazionale delle Ricerche (CNR) or Spanish’s Consejo Superior de Investigaciones Científicas (CSIC)– and science academies from Eastern Europe countries and Asia including China, Russia (Russian only) or Ucrania have highly complex institutional structures consisting of tens or hundreds of research institutes with diverse scientific missions. From a scientometric point of view, the characterization of such institutional complexity demands the use of performance indicators that go beyond global structures and put the focus on each institute, research center and research laboratory that make up these scientific organizations.
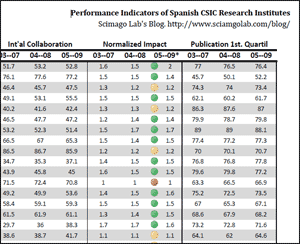
With this in mind, this post starts up a series of posts devoted to characterizing the research activity carried out at national research councils and science academies all over the world, through scientometric methods and from an agglutinative perspective. The following table (in PDF format) shows scientometric indicators of research output, impact and collaboration related to Spanish’s CSIC research institutes, its main goal does not consist in making a ranking table of CSIC centers, but to highlight some of the differential characteristics involving the research outcomes achieved by these institutes.
In order to show value trends, the table includes three consecutive 5-year periods (2003-2007, 2004-2008 and 2005-2009). Ranking criteria is the output of institutions during the period 2005-2009. Also, the institutes are color-marked to indicate which ones have Normalized Impact values higher than CSIC NI average, which overpass Spanish NI average and which ones fall below.
Beforehand, to help put the information in the table into context, we include here the same indicators referred to CSIC entire institution and to Spain. CSIC represents 15.3% of the total Spanish research output:
| CSIC | Output | %IC | NI | %Q1 |
| 2003-2007 | 35,429 | 47.8 | 1.4 | 69.9 |
| 2004-2008 | 38,665 | 48.6 | 1.4 | 69.5 |
| 2005-2009 | 41,929 | 49.4 | 1.4 | 68.7 |
| SPAIN | Output | %IC | NI | %Q1 |
| 2003-2007 | 230,731 | 33.3 | 1.1 | 49.3 |
| 2004-2008 | 252,422 | 33.9 | 1.1 | 48.4 |
| 2005-2009 | 273,482 | 34.8 | 1.1 | 47.8 |
The indicators
Output
The output or number of scientific papers published in scholarly journals reveals the ability of an institution to produce scientific knowledge. Output values are affected by institution sizes and research profiles, among others factors. The Output indicator forms the basis for more complex metrics. At co-authored publications a score is assigned to each contributing institution through the author’s institutional address.
International Collaboration IC(%)
This indicator shows the ability of institutions to create international research links through the output ratio that has been produced in collaboration with foreign institutions. The values are computed by analyzing the institution’s output whose affiliations include more than one country address.
Normalized Impact NI
Normalized Impact scores indicate the scientific impact that institutions have over the scientific community. In order to obtain a fair measurement of such impact, its calculation removes the influence due to institutions’ size and research profile making it ideal for comparing research performance. Normalized Impact values show the ratio between the average scientific impact of an institution and the world average impact of publications of the same time frame, document type and subject category. The values are expressed in percentages and show the relationship of the institution’s average impact to the world average, which is 1, –i.e. a score of 0.8 means the institution is cited 20% below world average and 1.3 means the institution is cited 30% above world average. Normalized Impact is computed using the methodology established by the Karolinska Intitutet in Sweden where it is named “Item oriented field normalized citation score average”. The long name used is because the normalization of the citation values is done on an individual article level. Further information on the methodology at Bibliometric Handbook for Karolinska Institutet.
High Quality Publications Q1(%)
Ratio of publications an institution publishes in the world most influential scholarly journals. Journals considered for this indicator are those ranked in the first quartile (25%) in their categories as ordered by SCImago Journal Rank SJR indicator.