The way we explore scientific research is changing rapidly. With thousands of journals and metrics from over 230 countries, it’s no longer enough to simply store data. Researchers, institutions, and policymakers need reliable, easy-to-understand information to make decisions about funding, publishing, and collaboration.
The SCImago Journal & Country Rank (SJR) portal has long been a key resource for this kind of information. Its 2024-2025 redesign goes beyond aesthetics to make the portal easier to use, more interactive, and visually intuitive for both new users and experienced researchers.
A Simpler, Smarter Homepage
The redesigned homepage acts as a command center, helping users focus on their most common tasks without distraction. Instead of overwhelming users with dense tables and long lists, it now presents three main sections:
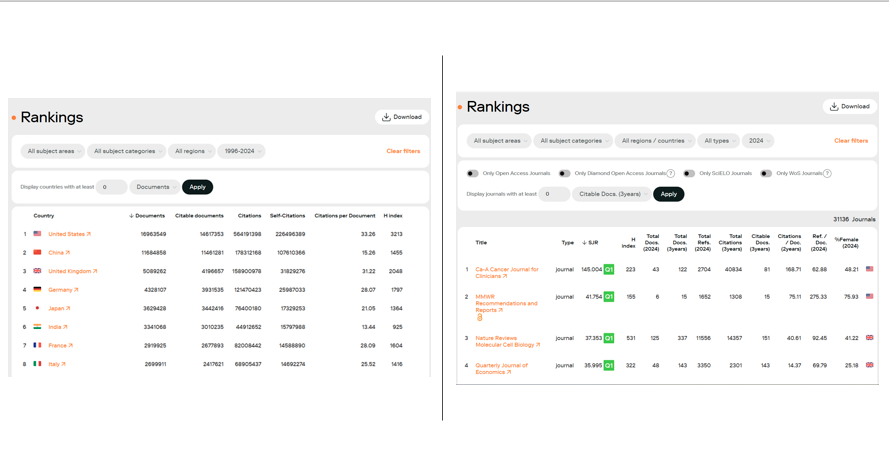
- Journal Rankings: This is the most used feature. Users can quickly look up journals, compare scores, and understand trends in their field. Rankings include detailed metrics such as SJR scores, citations per document, H-index, and even the percentage of female authorship.
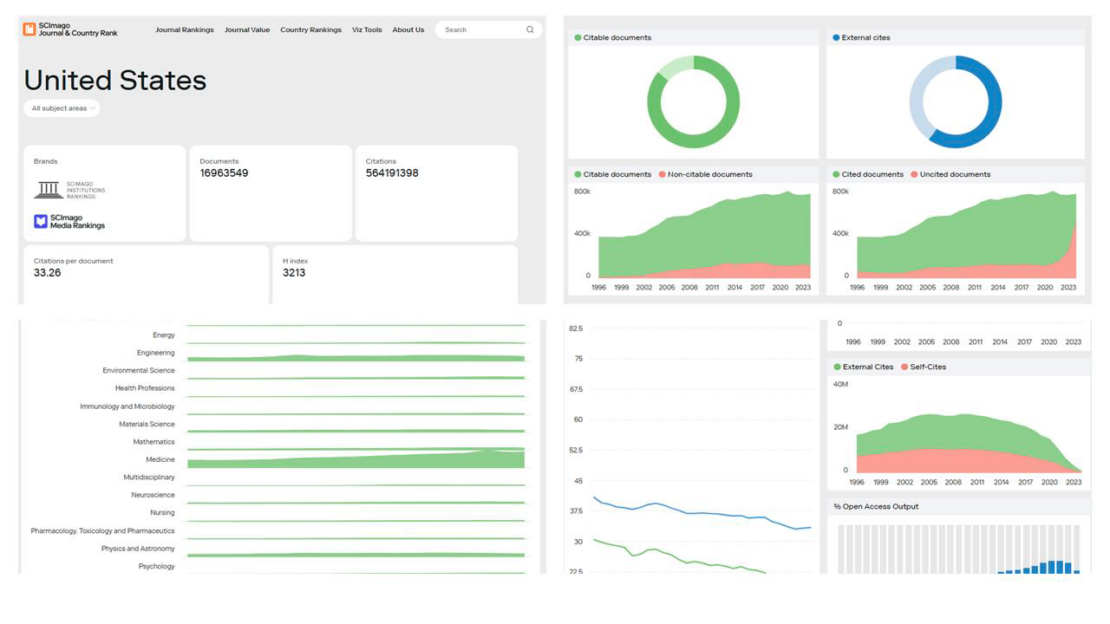
- Country Rankings: Users can explore the scientific output of entire countries or regions. This allows for macro-level insights, such as tracking research growth, identifying leading nations in specific fields, and comparing emerging research hubs with established centers.
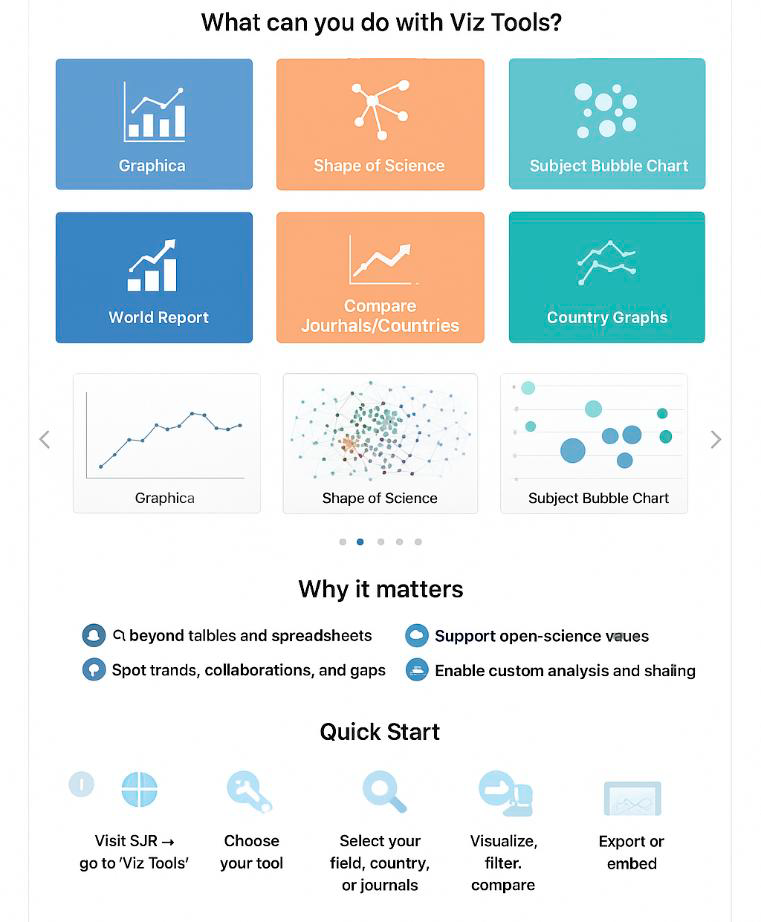
- Visualization Tools: Previously secondary, these tools are now central. Interactive graphics, maps, and network diagrams let users see patterns and connections in research data that tables alone cannot show.
The design makes navigation intuitive. The search bar is always visible, while menus and links are organized logically so even first-time users can understand the interface within minutes.
Clear Visual Design
The portal now has a modern, cohesive visual style that emphasizes clarity and readability:
- Neutral backgrounds allow dense tables to be easily scanned without eye strain.
- Semantic color coding shows quartiles (Q1 to Q4) at a glance. Green highlights top journals, yellow indicates mid-tier, and red identifies lower-tier rankings. These colors are now more accessible and easier on the eyes.
- Readable fonts ensure that numbers in tables—like SJR, citations, and H-index—are distinguishable even at small sizes.
This design consistency is maintained across SCImago’s suite of products, including SCImago Institutions Rankings, SCImago Media Rankings, SCImago Graphica, and SCImago Iber, so users experience a unified platform with minimal learning curve.
Powerful Filters and Data Tools
The redesigned portal allows researchers to drill down into data like never before:
- Faceted filters let users select journals by subject area, subcategory, region, country, or research funding requirements.
- Open Access visibility is highlighted, helping users identify freely available journals. This is particularly useful for researchers in institutions with limited subscription access or for projects requiring open-access publication.
- Interactive tables allow sorting by multiple metrics, quick comparisons, and detailed insights into trends over time.
The portal also includes embeddable widgets for journals, so websites and institutional pages can display ranking badges and link back to the portal. This encourages transparency and drives engagement with SCImago data.
Exploring Science Visually
The portal’s visualization tools transform data into visual insights:
- The Shape of Science maps relationships between journals, showing clusters of interdisciplinary research. For example, AI journals may appear near neuroscience journals, highlighting unexpected research connections. Users can zoom, pan, and select nodes for detailed metrics.
- SCImago Graphica allows users to create custom charts and visualizations using portal data.
- This “drag-and-drop” functionality makes it easy for users to present data visually in reports or publications, turning raw rankings into compelling stories.
These tools make complex data accessible to a wide audience, from graduate students to senior research administrators.
Mobile and Performance Updates
Researchers increasingly need access on the go, and the portal now delivers:
- Responsive tables adapt to mobile screens, freezing key columns and allowing horizontal scrolling for detailed metrics.
- Optimized visualizations load efficiently, so complex network maps render smoothly without slowing down the page.
- Quick lookups on mobile are easier, allowing users to check journal quartiles or country rankings during conferences or field research.
While detailed analysis is still best on a desktop, the mobile improvements make SJR practical for everyday use outside the office.
How SJR Stands Out
Compared with other platforms, SCImago SJR offers:
- Open Access: Free access for anyone, unlike subscription-based services.
- Visual and interactive tools: Making it easy to explore and present data.
- Comprehensive coverage: Over 34,000 journals and 230+ countries.
- User-focused design: Minimalist, modern interface that balances simplicity with powerful data analysis.
These features make SJR particularly valuable for researchers who want both high-level insights and detailed metrics without being overwhelmed by complexity.
The 2024-2025 SJR redesign transforms the portal into a smarter, more accessible, and visually engaging tool. It balances depth of information with ease of use, helping users:
- Quickly identify top journals in their field.
- Compare research output across countries or regions.
- Explore interdisciplinary connections with interactive graphics.
- Access Open Access journals and metrics for compliance or reporting.
The portal continues to set a high standard for open-access scientific evaluation, making complex research data understandable, actionable, and visually compelling.
Explore the redesigned portal today at SCImago Journal & Country Rank.