SCImago Research Centers Ranking – MENA Region
El Ranking de Centros de Investigación SCImago mide los resultados de investigación y la colaboración entre centros de investigación de la región MENA.
Más información...Actualidad del sector y de Scimago Lab
El Ranking de Centros de Investigación SCImago mide los resultados de investigación y la colaboración entre centros de investigación de la región MENA.
Más información...
Le ayudamos a mejorar la visibilidad científica de su revista a trevés de 6 claves muy concretas y algunas herramientas que se convertirán en sus aliadas.
Más información...Le mostramos la clave para averiguar porqué sus artículos no están siendo citados y qué hacer para resolver este problema
Más información...Conozca las claves que necesita para maximizar su visibilidad científica, logrando así un mayor impacto y mejorando su reputación en la comunidad académica.
Más información...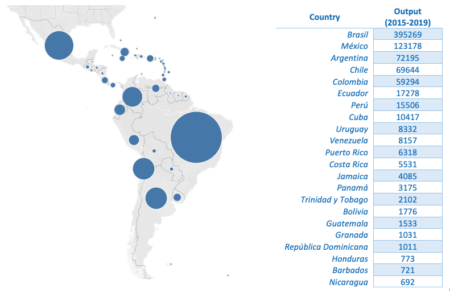
Análisis de la producción científica latinoamericana para identificar tendencias asociadas a aspectos políticos, sociales y académicos
Más información...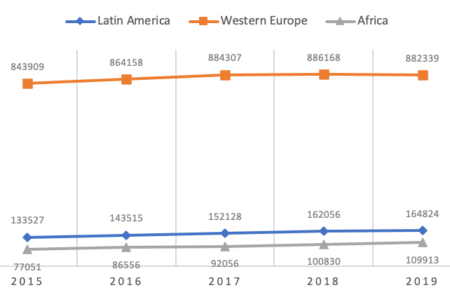
Comparación y análisis para entender el papel del “tamaño” en los resultados científicos y en los indicadores cienciométricos
Más información...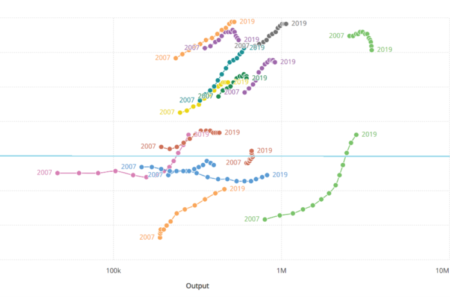
El análisis de la evolución de la producción e impacto científico en el mundo, concluye que los países que más recursos económicos destinan a la ciencia no sólo producen más, sino que también producen con mayor impacto
Más información...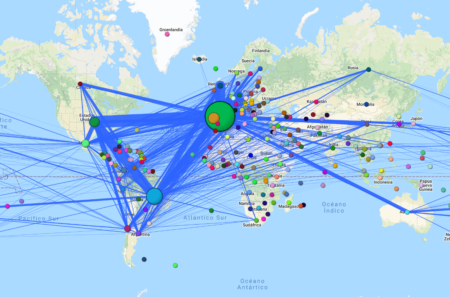
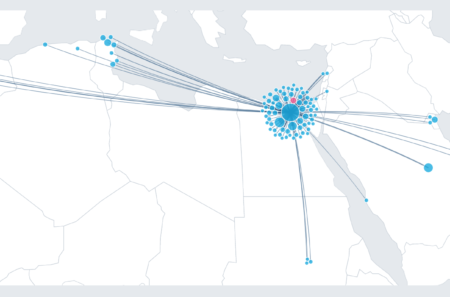
Mapa de la colaboración científica en el mundo
Más información...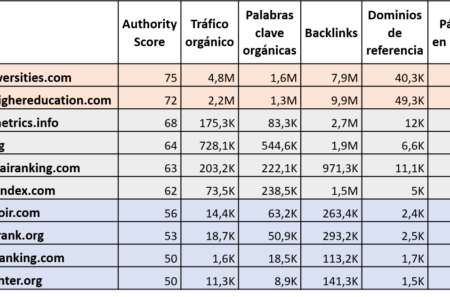
Representamos de forma ordenada y categorizada la visibilidad web de los principales rankings de universidades
Más información...