Borja González Pereira
We, at Scimago Lab, include the Normalized Impact indicator in every ranking SIR we build, both in world and iberoamerican series. This indicator can be seen as a substitute to the overused Impact Factor as it conveniently captures the scientific impact of institutions and corrects the biases generated when heterogeneous outputs –such as those coming from big universities– are analyzed. This post is the first of a series of two in which we describe its main features and computation methods.
When the scientific output of an university is analyzed to evaluate its impact and compare it to other universities’, we must have in mind that there exists many factors influencing the amount of citations achieved by the university such as the research thematic profile, the document types where its output is published, the “age” of the papers under analysis, etc. These biases make a direct comparison on the quantity of citations obtained by universities unfeasible, therefore rankings built over raw citation counts should be avoided. It should happen the same to journal rankings (as IF based journal rankings), but that matter will not be discussed here.
At the level of Universities and large Research Centres (national agencies, big companies, etc), the Normalized Impact indicator is more efficient to reveal the scientific impact (or visibility) of institutions outputs because it includes some tools to correct the topic-type-age biases. The Normalized Impact amends the citation value achieved by every paper by comparing it to an international standard, thus in this way it normalizes the disparity of citation scores obtained by papers in different domains, with different ages and of different types.
Between Thematic Domains
There exists different citation behaviours in different areas of Science, so it cannot be directly compared the citedeness of papers in Medicine with works on Social Sciences, Engineering, Life Sciences nor Health Life. Every thematic domain has its own citation patterns.
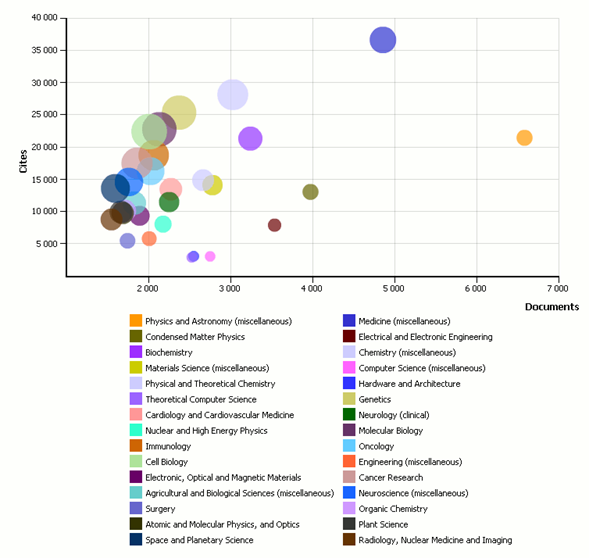
The following bubble chart shows Germany’s 30 Top Subject Categories by number of documents published in the period 2009-2010. Bubble size represents Citations per Document in the area. The big light green bubble correspond to Cell Biology –located between 20,000 and 25,000 Cites in the vertical axis– (11.13 citations per document) while the wine-red little one down in the middle correspond to Electrical and Electronic Engineering (2.23 citations per document). So how would influence this parameter to a university output that had a strong Engineering focus? It seems clear that using Impact Factor (or any other non-standardized methodology) to build the rank would push it down, no matter how good it was in its research.
Between different document types
There also exists different citation patterns among the various types of papers/articles/reviews/etc. traditionally included in scholarly journals. So reviews should not be directly compared with papers (original article), conference papers, letters, etc.
Among different papers’ “ages”
Usually, when a ranking is built, the output of universities to be compared includes sets of papers with different ages, that is, papers that have been published in several years. But a paper that has been published three years before another one has more chances to achieve citations because it has had more time to be known by the scientific community, so the ages of the papers in the set influence the number of expected citations.
The following chart shows year by year citedeness achieved by Canada’s output, both the total number of citations and self-citations (that is, canadian papers citing ohter canadian papers). It is clear how the line declines at the end, when it approximates to the current date. So should 2006 output be evenly compared to 2010′s when less citations are “being played”? It must be taken into account that when universities are compared to build rankings, papers from differente ages a measured with this evident age bias.
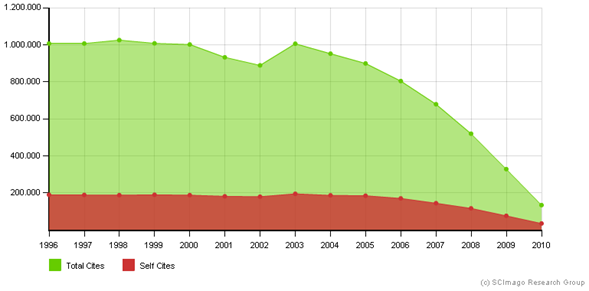
Source: SCImago Journal and Country Rankg. Period: 2009-2010
How international standards are built
What NI makes is to build citation standards that are used to normalize the citation achieved by an institution. The normalization is then carried out paper by paper o just in one time by summing up all the university citations (i.e. citations received by the whole output of and institution) and normalizing later.
The citation value of a “standard paper” is computed for every topic-type-age relationship. For instance, to build a “standard 2008 review in Oncology” the citations to every Review in Oncolgy published in 2008 are counted and then divided by the number of reviews or to build a “standard 2009 original article in Applied Mathematics” the mean of citations achieved by all the Original Articles in Applied Mathematics published in 2009 is computed. This is done for each one of these triads so at the end of this process we have a bunch of standard paper values ready to be used to normalize the output of institutions.
How to interpret NI scores
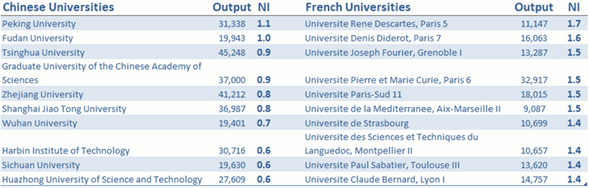
NI scores are standardized to the world average which is asigned a value of 1, then a score of 0.8 means the institution is cited 20% below world average and 1.3 means the institution is cited 30% above world average.
The following chart shows the Top Ten universities by output in China and France ordering them by NI scores. As can be seen, just two Chinese universities equal or exceed the world average barrier, to the rest their scientific impact is lower than the international standard, in some a 40% lower (those that have 0.6 score) On the other hand, french largest universities present scientific outputs with significant impact, all of the over 40% of the world average (1.4 to 1.7)
In the following post of this series we will talk about the two main methods to compute the Normalized Impact indicator: the so called CROWN indicator by the University of Leiden and the “Field Normalized Citation Score” set by the Karolinska Instituet. We will also compare NI with other indicators used in SIR Rankings and describe its features.